Unleash revenue across marketplaces
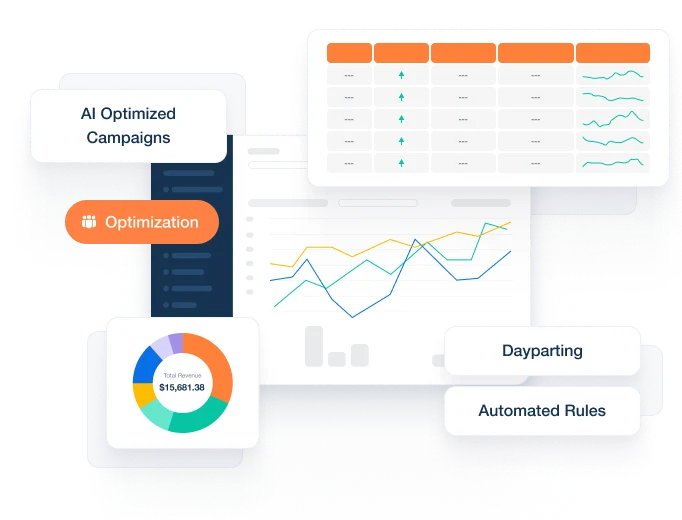
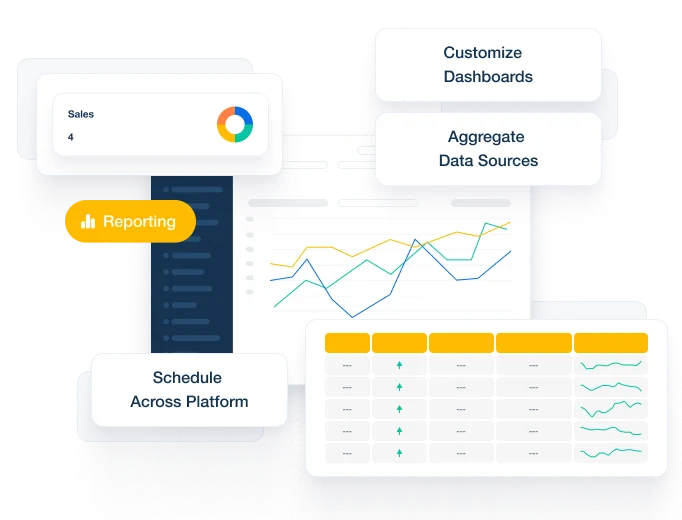
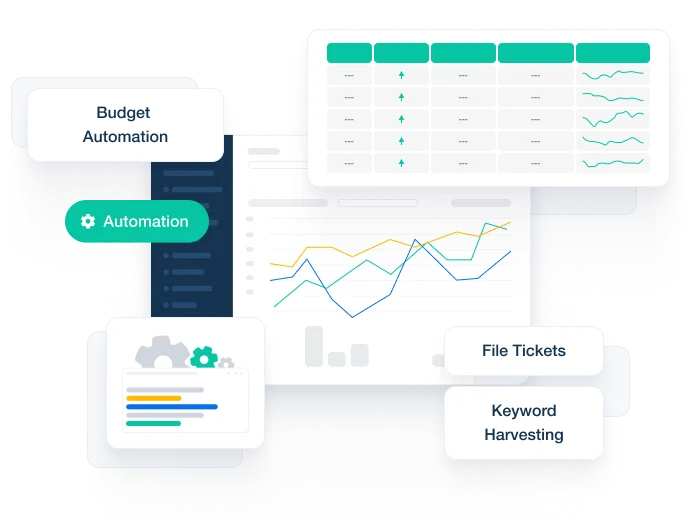
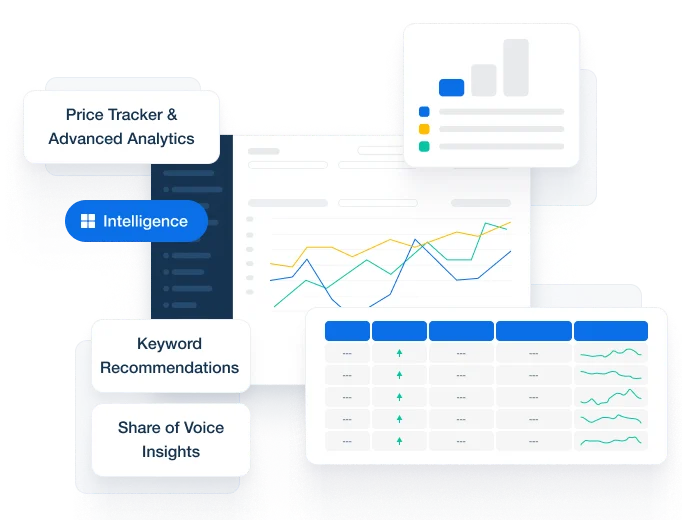
Pacvue's commerce acceleration platform unifies retail media, commerce management and robust measurement tools into one solution, powering a winning omnichannel strategy across 90+ marketplaces
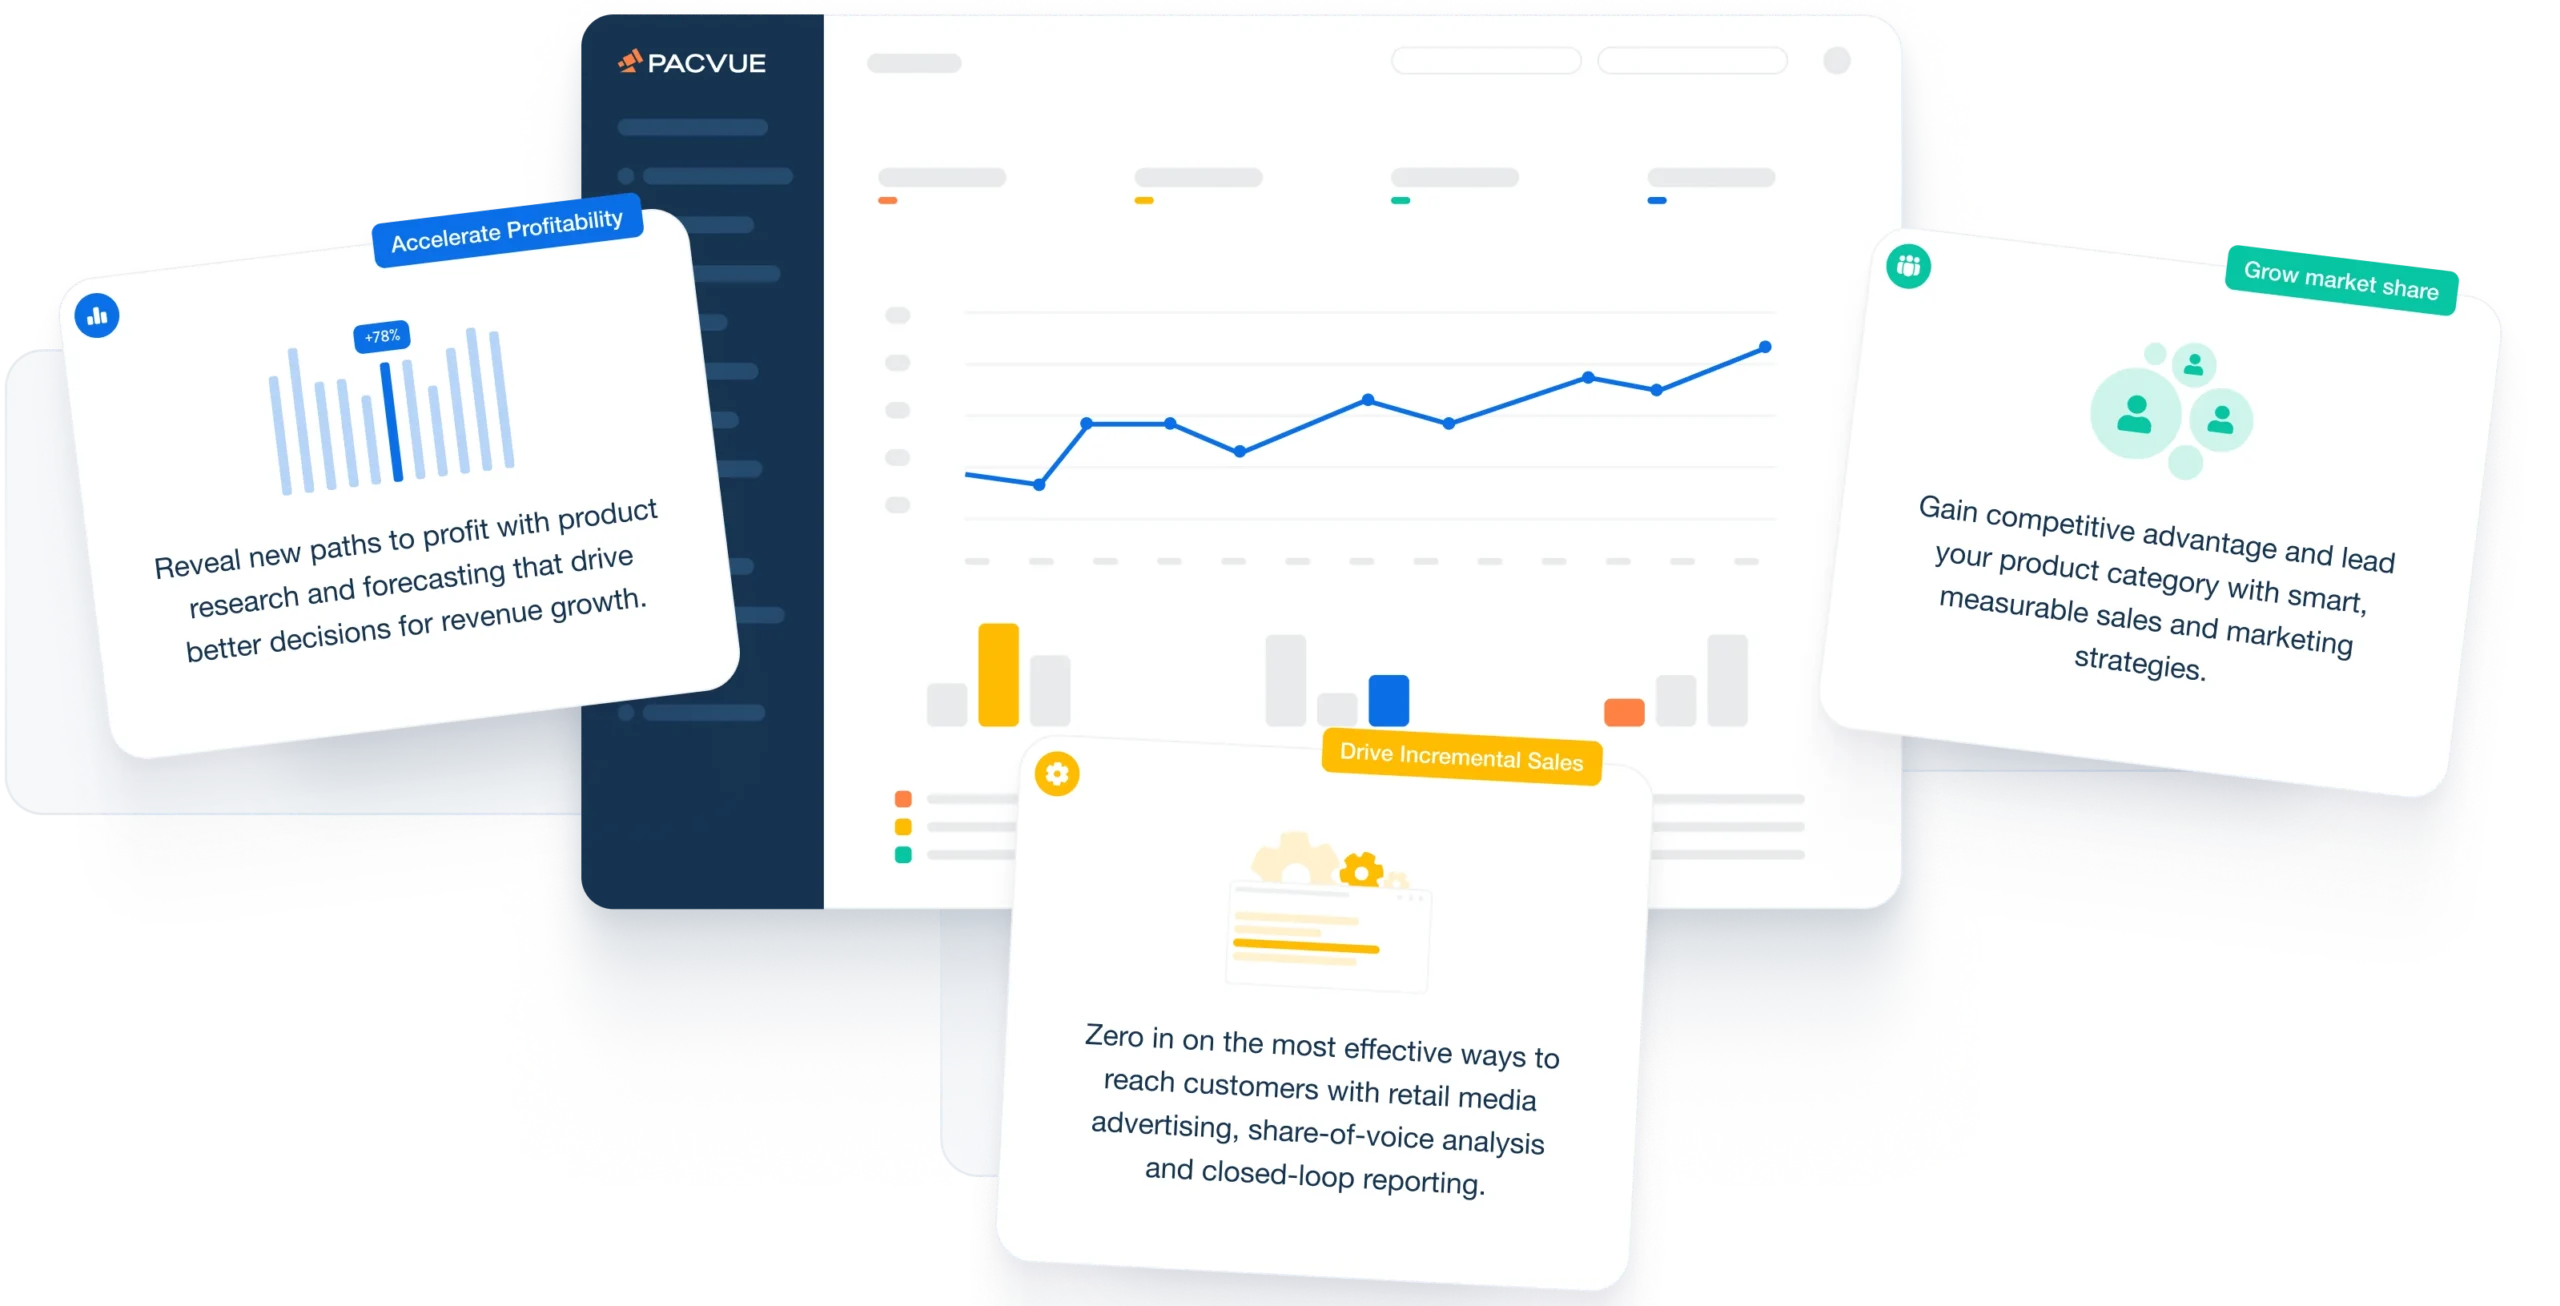
Your catalyst for unprecedented brand growth
$150B+
GMV driven for brands and agencies
$13B+
Optimized ad spend via the platform
30+
Countries
Who we serve
The Pacvue commerce acceleration platform empowers enterprise brands and agencies with integrated operations, retail media, and measurement.
Latest commerce insights from Pacvue

2023 Q1 CPC Webinar: Unlocking Profitability with Ad Performance Insights and Strategies
Exclusive insights from Pacvue’s comprehensive research on Q1 ad performance for both Amazon and Walmart.

2023 Retail Media Performance Report: Q4 2022 Benchmarks from Amazon, Walmart, & Instacart
Q4 2022 will be remembered for one of the largest holiday event pushes ever, with Cyber Monday sales reaching $240B alone. Despite that impressive activity, consumer sentiment and economic signals point to higher uncertainty in 2023. What does this mean for brands? To help you answer this question, we analyzed Q4 2022 retail media performance. […]

2023 Industry Reflections: Looking Back and Ahead
Today, we are experiencing a shift towards seamless commerce. Consumers have high expectations, are increasingly using digital channels to shop, and value the convenience of frictionless transactions. Both retailers and manufacturers are building infrastructures that support these preferences. Brands are also coping with the industry shift away from third-party data, forcing more attention closer to […]


Ready to grow your business?
Grow and scale your business with an all-in-one commerce acceleration platform.
Awards & Recognitions


