
Unleash revenue across marketplaces
Pacvue's commerce acceleration platform unifies retail media, commerce management and robust measurement tools into one solution, powering a winning omnichannel strategy across 90+ marketplaces
Trusted by leading brands and agencies
Your catalyst for unprecedented brand growth
$150B+
GMV driven for brands and agencies
$13B+
Optimized ad spend via the platform
30+
Countries

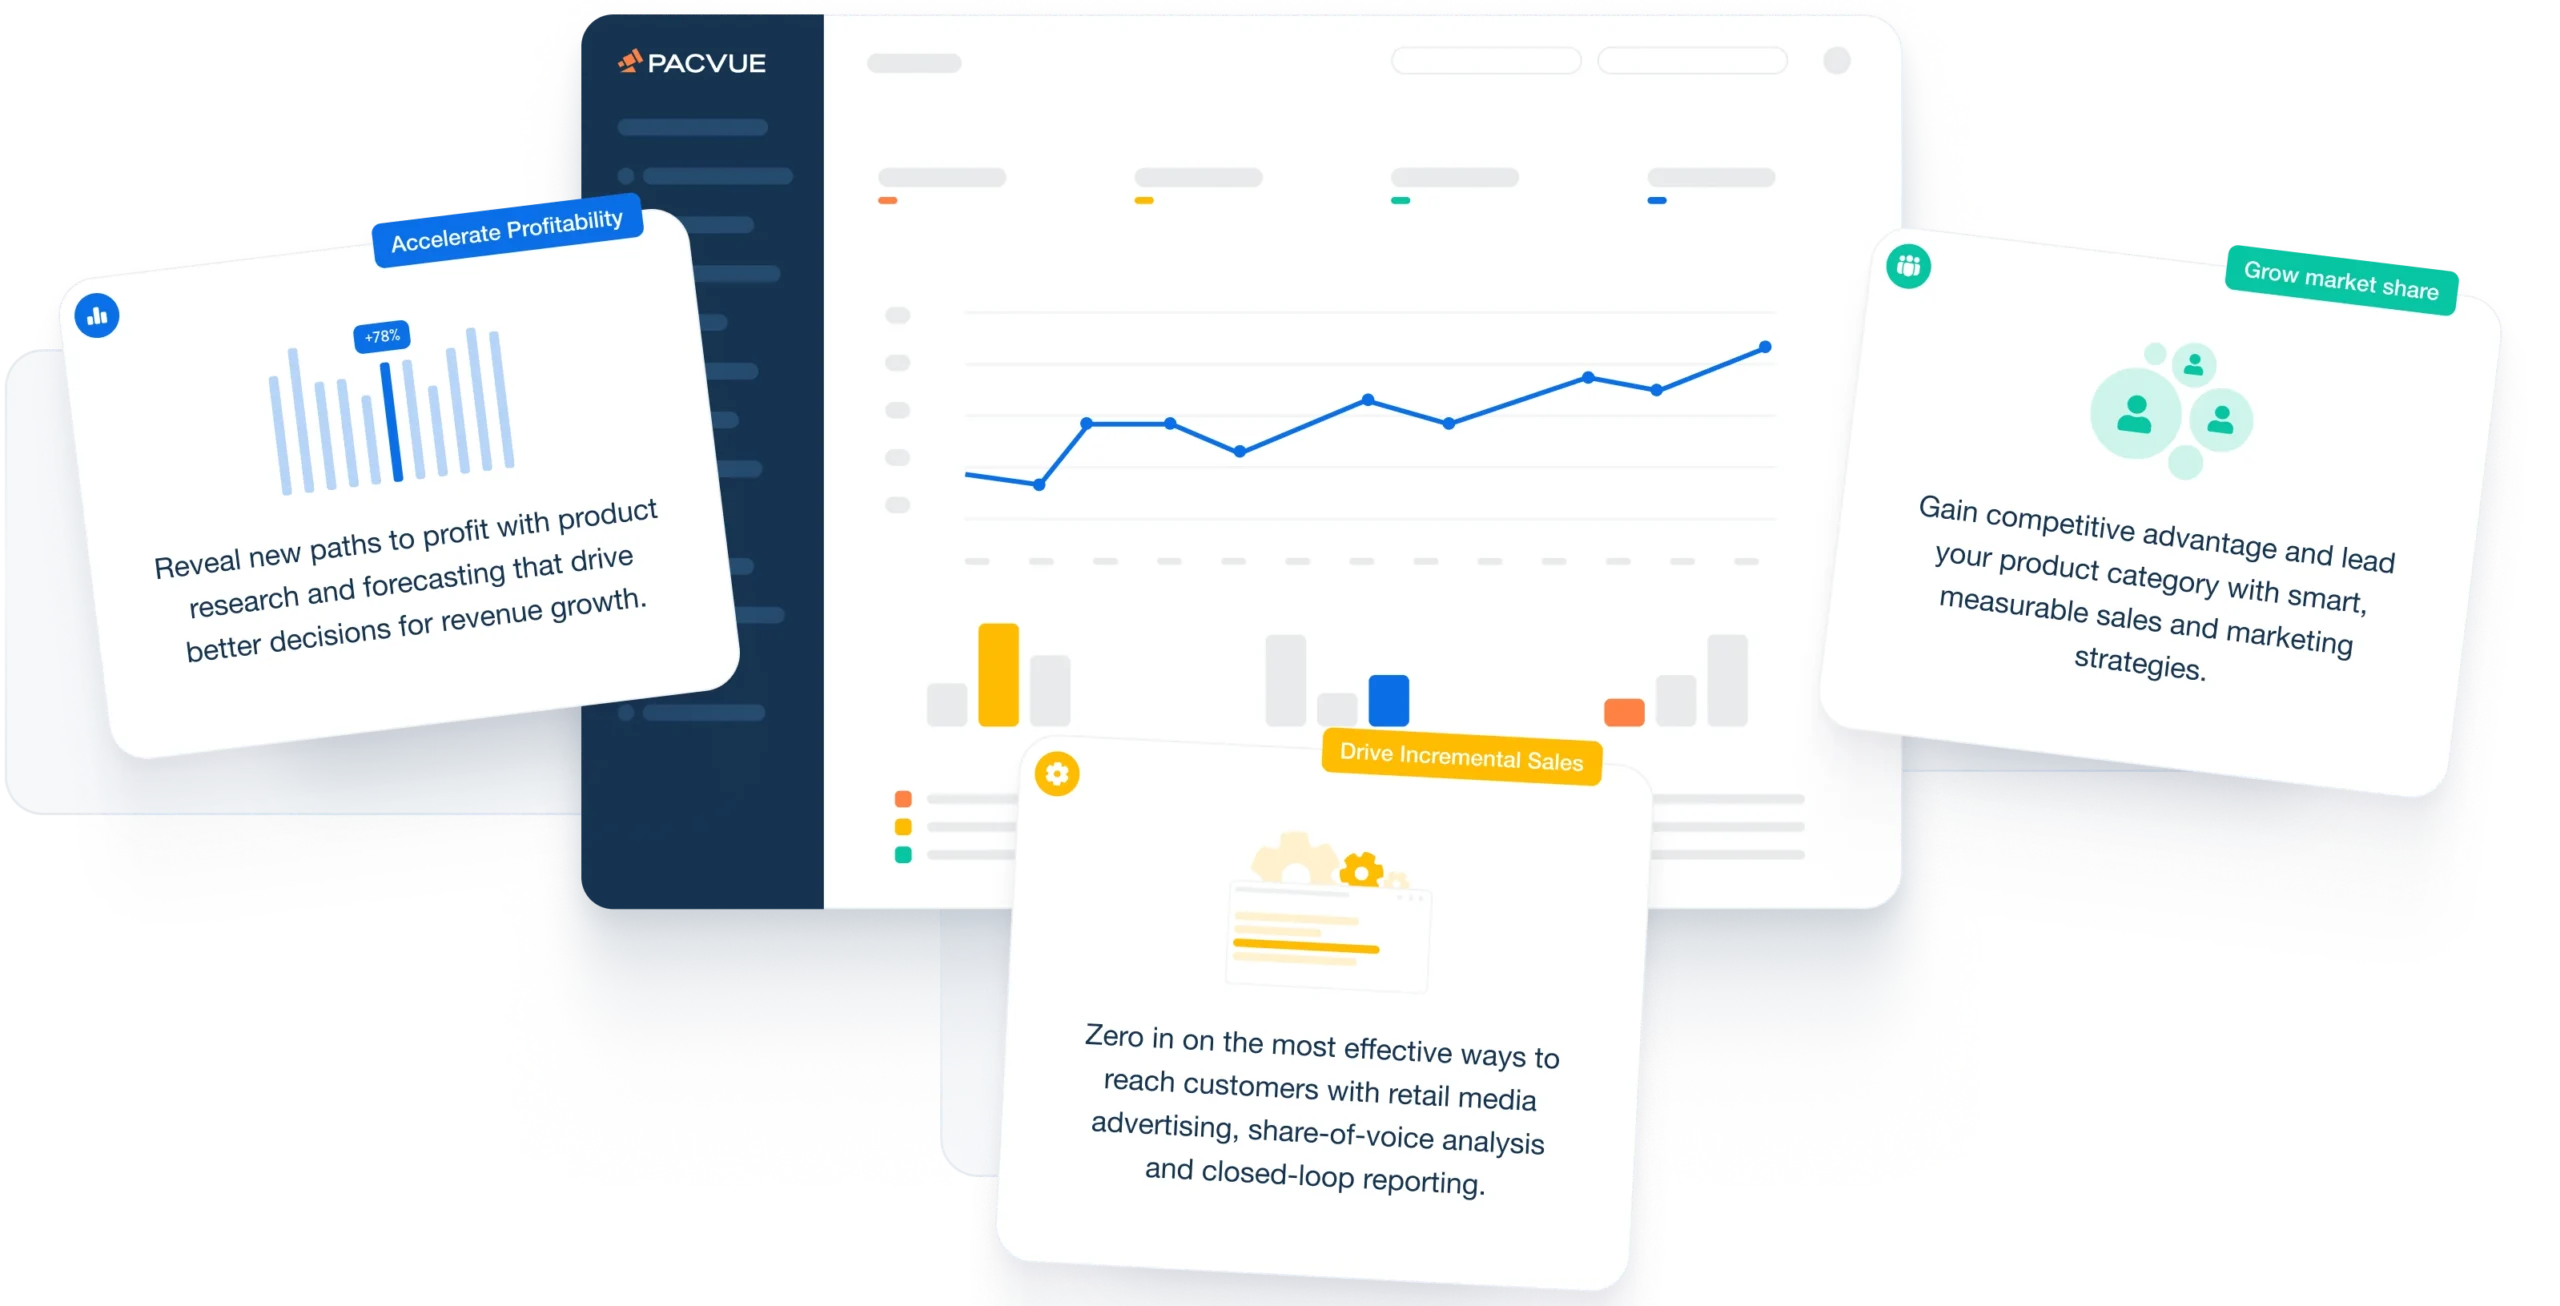
Leverage insights in real-time and action on the most impactful opportunities
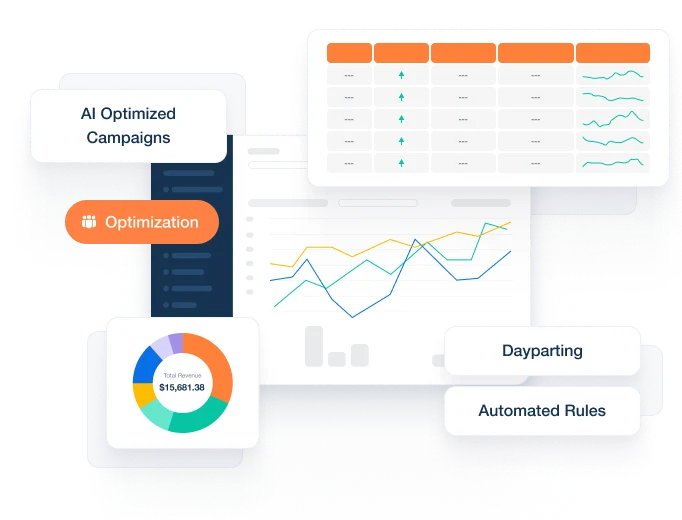
Optimize commerce for better performance
Streamline retail media advertising and optimize bids based on dozens of centralized data points. Leverage AI-powered recommendations, so you can:
- Increase market share with optimized bids relying on complex signals
- Manage the most important variables with highest Buy Box impact
- Beat competitors with optimized pricing, promotion, and ads strategy
“Pacvue keeps us a step ahead of competitors as AMC becomes more complex. New efficiencies in segment targeting drove ACOS improvements of over 1,000bps.”
Duracell Real full story →
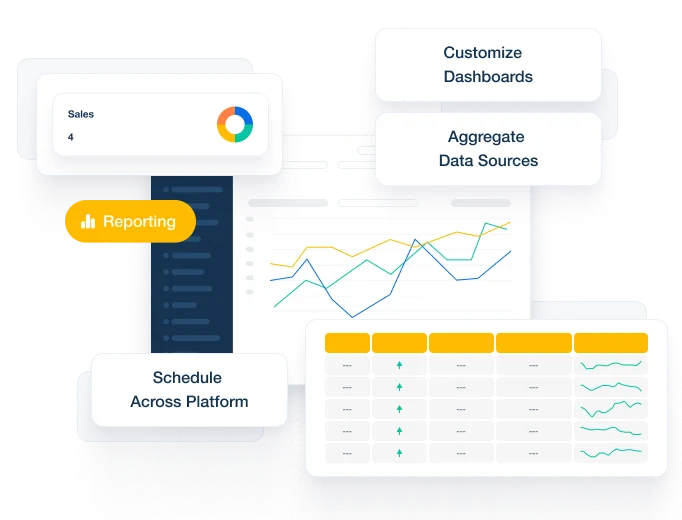
Act on real-time insights
Understand impact of advertising in real-time. Utilize dynamic reporting, based on granular-level data, for smarter decision-making, so you can:
- Schedule reports across multiple retailers in one platform
- Customize dashboards that align with your brand's top KPIs
- Aggregate disparate data sources and APIs into a single platform
"Pacvue's Excel plug-in streamlines reporting, saving time and increasing efficiency. This allows us to customize our strategy at a granular level."
Bissell Read full story →
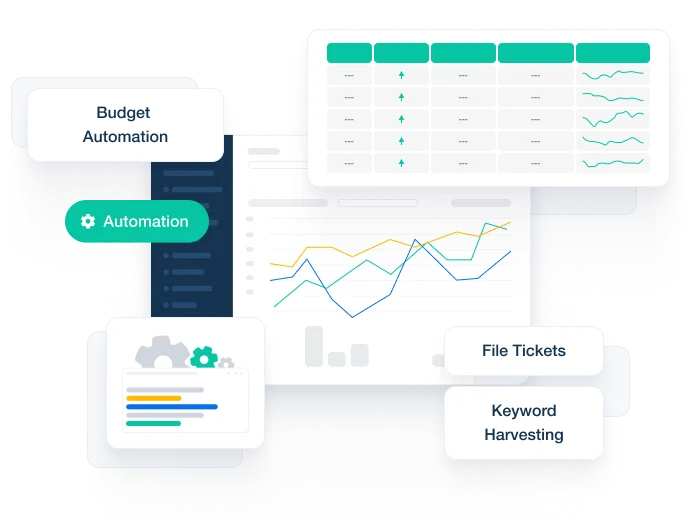
Automate repetitive campaign tasks
Spend more time on strategy and content and let Pacvue's goal-driven platform handle bid adjustments and reporting. Create rule-based automations so you can:
- Expand traffic dynamically with automated keyword harvesting
- Increase spend efficiency through dayparting with hourly bid boosting
- Expand traffic dynamically with automated keyword harvesting
- Eliminate manual marketplace management with automated ticketing filing
"Pacvue efficiently scales our Amazon campaigns, saving countless hours each week, and unlocks access to important metrics in one central location."
Tuft & Needle Read full story →
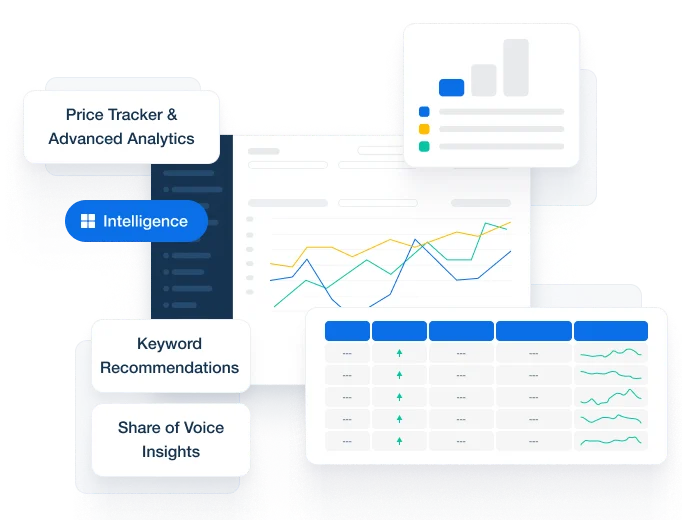
Intelligence to help win your category
Stay ahead of the competition, bid for first place, and measure total sales against your category. Pacvue helps you get on page one faster by empowering you to:
- Surface hidden keyword recommendations to increase content relevancy
- Increase market share from share of voice insights and measurement
- Enable price tracking compression across retailers
"Pacvue creates order from the chaos of advertising on Amazon, allowing the freedom to analyze, the ability to create, and the edge to succeed."
Lunge Marketing Read full story →
Commerce is increasingly complex (and competitive). Pacvue unifies all commerce data, helping to eliminate blindspots and answer:
How should I prioritize investments in constantly evolving retailer networks?
How can I coordinate commerce activities across teams to deliver on our brand KPIs?
How can we best leverage siloed 1P and 3P data to make optimal advertising decisions?
How can I grow profit margins with incremental investment and unclear measurements?
Who we serve
The Pacvue commerce acceleration platform empowers enterprise brands and agencies with integrated operations, retail media, and measurement.
Brands
Build brand awareness, capture market share, and increase sales.
Agencies
Manage your clients' ad campaigns efficiently, and prove your impact.
See how we power growth for 70,000+ brands and agencies

140%
increase in sales
Learn how Publicis Media achieved a 140% increase in sales for L'Oréal by harnessing the power of Pacvue to revolutionize their commerce
Read full case studyPublicis Media harnessed the power of Pacvue solutions to revolutionize their advertising efforts. Together, they optimized campaign performance, curbed out-of-budget expenditures during pivotal sales events, and mitigated brand cannibalization on competitive keywords.
Publicis Media for L’Oreal

91%
increase in return on ad spend
Learn how Reckitt boosted ROAS by 91% with Pacvue and AMC insights
Read full case studyLeveraging AMC attribution, Reckitt optimized their media mix to run Sponsored Search (SP + SB) and Display (DSP) in parallel. Reckitt's success with AMC insights showcases the potential for brands to optimize their advertising strategies with Pacvue by leveraging centralized data to drive more effective remarketing and loyalty campaigns, ultimately resulting in increased sales and ROAS.
Reckitt for Enfamil® on Amazon
12%
increase in sales per conversion
Learn how Sabra dives deep into Amazon campaign automation with Pacvue
Read full case studyThe Pacvue team is absolutely amazing partners to work with, and their tech is top-notch. The ability to dive deep into our search campaigns beyond what we normally get with retailers or ad networks is really great. We can automate rules, implement day parting, get a ton of insights, and ultimately optimize to get better results than what we had in the past.
Sabra for Amazon

79%
increase in return on ad spend
Learn how Nestlé Purina prioritizes budget on Prime Day with Pacvue
Read full case studyBy leveraging Pacvue’s technology with the strategic insights from the team at Performics, we have seen significant improvements in our Amazon performance. Utilising this specific budget strategy helped us to deliver our best ever Prime Day results and really set ourselves up for success for the upcoming events.
Nestlé Purina for Amazon

72%
increase in return on ad spend
Learn how Hisense increased Walmart advertising ROAS 72% with Pacvue
Read full case studyBy using Pacvue’s reporting feature, Hisense was able to quickly identify which platform and placement performed best and make appropriate bid modifiers. After adding bid modifiers, Hisense saw a 72% increase in ROAS, 46% increase in CVR and a 10% decrease in CPC.
Hisense for Walmart
Latest commerce insights from Pacvue
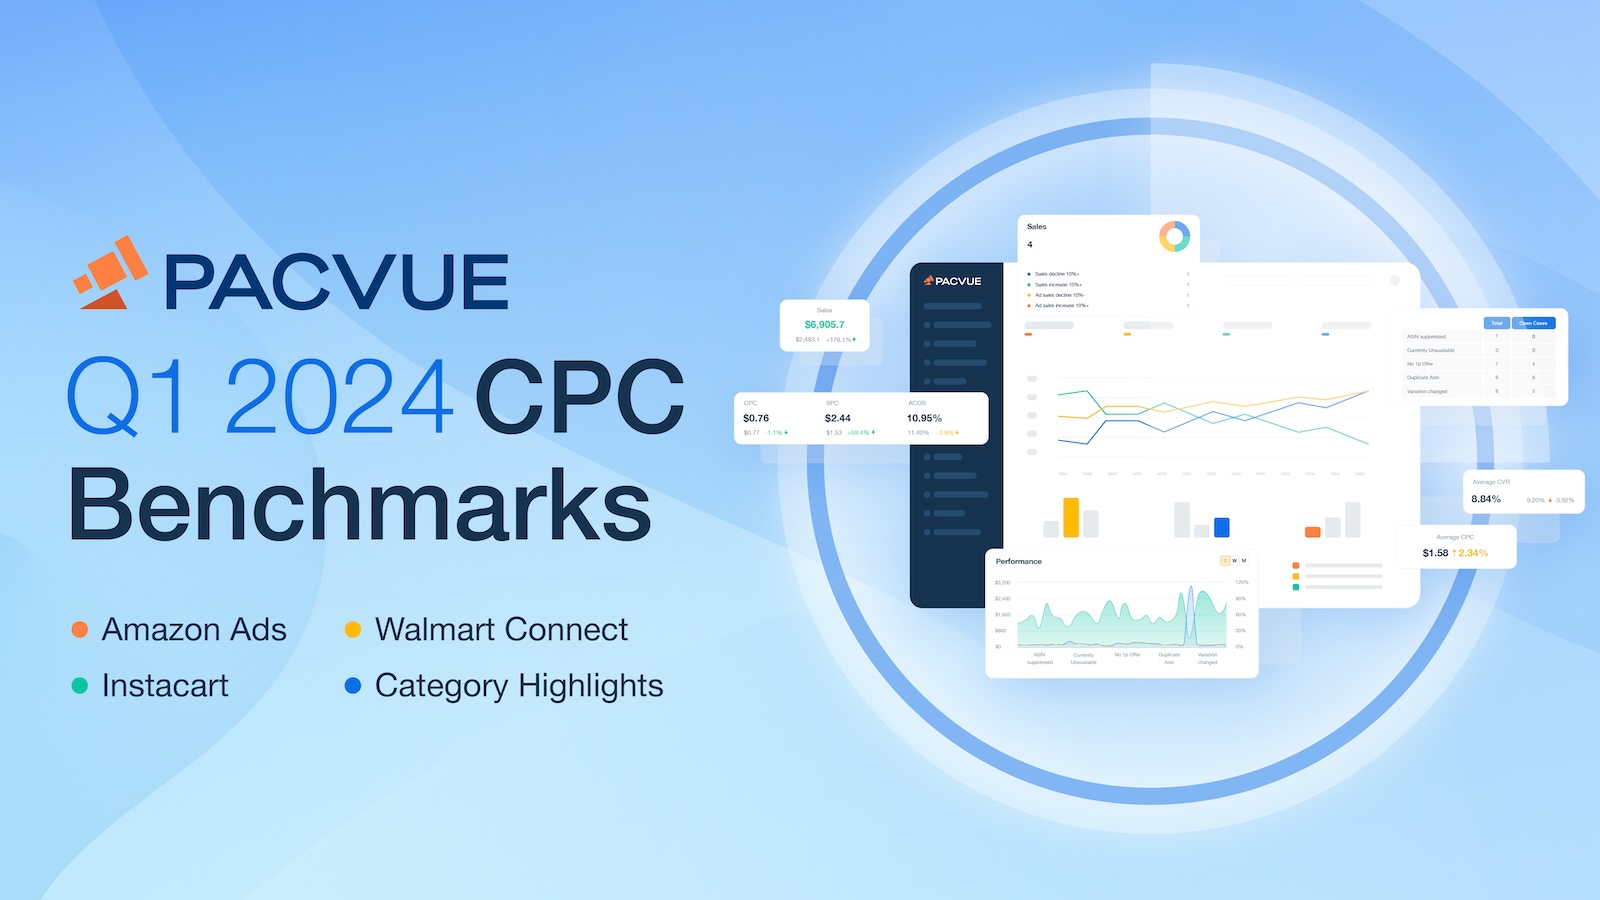
Q1 2024 CPC Report: Retail Media Benchmarks
Explore performance data from Amazon, Walmart Connect, and Instacart, highlighting trends and benchmarks across the marketplaces.
Top Strategies to Win Amazon Prime Day 2024
Amazon Prime Day 2024 is quickly approaching. Although the dates have yet to be confirmed, Prime Day will likely fall in the middle of July. Last year, the 48-hour Prime Day window marked the largest event to date, with U.S. sales hitting a staggering $12.7 billion, a notable 6.1% increase from the previous year. […]

Reach New Audiences with Amazon Streaming TV and Sponsored TV
Streaming TV and Sponsored TV campaigns enable advertisers to engage with audiences across their shopping and entertainment journeys, with many brands already achieving success through these channels. Leveraging the right technology to launch and manage video campaigns can significantly optimize reach, making it a game-changer for brands. According to Insider Intelligence, over 115 million households […]
Ready to grow your business?
Grow and scale your business with an all-in-one commerce acceleration platform.
Awards & Recognitions